Friday, May 30, 2008

Debugging reference count leaks

One of the hardest things is debugging a reference count leak. COM objects lifetime depends on the reference count (read here for more...). So each client of a COM object must call AddRef on the IUnknown interface when going to use it and it must call Release when done. If any client (and there might be many many of a single one) violates this rule you get into severe trouble.

Scenarios

1.) Number of Release calls = Number of AddRef calls

This is the normal scenario: As soon as no client needs the server object anymore it is getting destroyed

2.) Number of Release calls > Number of AddRef calls

If Release is called one time too often another client might crash because the server get's destroyed too early - bad thing here is that you see the crash in some place but this does not tell you where is root cause is located. All you know is which objects reference count has been corrupted.

3.) Number of AddRef calls > Number of Release calls

If AddRef is called one time too often the reference count never reaches 0 and hence the server object never get's destroyed. This is causing memory leaks and also might cause resource leaks. The effect of this scenario is much less obvious: You might see memory increasing over time and/or performance degrade and/or resources to be locked when they should be unlocked again.

Finding the place where the unbalanced AddRef/Release occurred might be like finding the needle in the hay. I did research in the Google reachable web but didn't find a good tool available that really assist's in this task. Luckily Sara Ford described in this post the first step you need to take in order to get the data necessary to drill down into the problem.

Somehow I didn't manage to set the trace points in Visual Studio 2005 (can anybody tell me how to set a break point on a single objects AddRef, Release methods?) so I launched my beloved WinDbg.

First I created script to create me an xml snippet for an event that alters the ref count (I didn't find a better name so I called it ToXml.txt and placed it into my scripts folder):

.printf "-->\n<Event><Ref>%d</Ref><![CDATA[",poi(${$arg1})
k100
.printf "]]></Event>\n<!--\n"

Then I placed a break point on the server objects constructor

bp MyServer!CMyClass::CMyClass

When the breakpoint hit, I stepped out <Shift>+<H11> into CComCreator::CreateInstance and then stepped over the p->SetVoid(pv); call in this class.
(I think it should be possible to set a breakpoint directly at MyServer!ATL::CComCreator<ATL::CComObject<CMyClass> >::CreateInstance+0xb1, but I didn't try...)

Now I gathered the address of m_dwRef by:

0:000> ?? &(p->m_dwRef)
long * 0x110d724c

Next thing to do is setting the data breakpoint by:

ba w4 0x110d724c "$$>a<C:/windbg/scripts/ToXml.txt 0f084cb4;gc"

(you might need to change the path 'C:/windbg/scripts/')

With .logopen we make sure that we directly write all events into an logfile:

.logopen c:\temp\Events.xml

Now let the application run with 'g' or <F5> and do whatever creates your ref counting problem.

When done break into and close the log with .logclose.

At this point we are half the way through. The Events.xml we created is not valid xml. You need to add

<?xml version="1.0" encoding="UTF-8"?>
<Events>
<!--

at the beginning and

--></Events>

at the end.

Now comes the tooling. In my scenario I had around 1400 Events - a little tedious to analyze all by hand.

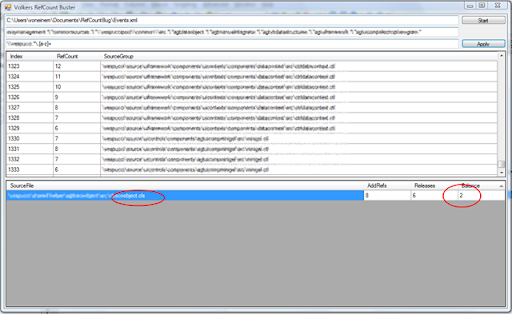
So I created "Volkers RefCount Buster" which does the following:

1.) After loading the file (enter path in first text box and press Start) all events are identified for either beeing AddRef or Release

2.) Then the call stack is taken to group the events:

First action is to exclude events that match the pattern entered in the second text box (exclude pattern):

var includeQuery = from frame in this.StackFrames.Frames

where String.IsNullOrEmpty(ExcludePattern) ? true : !excludePattern.IsMatch(frame)

select frame;

Then the remaining frames are searched for the selection pattern:

var selectionQuery = from frame in includeQuery

let match = selectionPattern.Match(frame)

where match.Success

select match.Value;

and the top most match is taken:

string sourceGroup = selectionQuery.FirstOrDefault();

the all events are grouped into the found source groups:

var ResultQuery = from refCountEvent in refCountEvents

group refCountEvent by refCountEvent.SourceGroup into g

select g;

Then the number of AddRefs and Releases is calculated for each group and accumulated:

foreach (var ResultSet in ResultQuery)

{

long numOfAddRefs = (from rce in ResultSet.AsEnumerable()

where rce.RefCountType == EventType.AddRef

select rce).Count();

long numOfReleases = (from rce in ResultSet.AsEnumerable()

where rce.RefCountType == EventType.Release

select rce).Count();

long balance = numOfAddRefs - numOfReleases;

...

Now it's up to you to find the Exclude Pattern and Selection Pattern that will directly point you to the component or file, that is the culprit. Then you just need to look at those stacks that belong to the found bad guy and you will also be able to see the source line that created the problem.
VolkersRefCountBuster

You can download the sources and binaries here...

Have fun,

Volker

Thursday, May 08, 2008

Windbg help is online...

Please correct me if I'm wrong, but at least some month ago there was online help for Debugging Tools for Windows on MSDN or anywhere else.

Now Microsoft put the (very good and helpful!) help online:

image

Have fun...

Tuesday, May 06, 2008

Windbg version 6.9.3.113 is out (I'm still keeping 6.7.5.0)

Microsoft released a new version of Debugging Tools for windows. As usual the installation bits can be grabbed here..

Unfortunately the integrated managed debugging that accidentally came in with version 6.7.5.0 is still missing :-(

Anyway here's the list of changes:

Highlights in Version 6.9.3.113

In this release, you will find better performance on systems with greater memory as well as those with large CPU counts. Better performance and reliability on transport initialization. Enhancements to dt, sx, z, !defwrites, !sysinfo, !gflags, Symsrv, as well as several others. For further details, please read the RELNOTES.TXT provided in the package.

Taken from the installation relnotes.txt:

* Fix kd to function properly when debugging 256 processor machine.
* Fix windbg window dragging performance problems when running under AERO
on Vista.
* Alert the user when a debug transport is already opened by another
instance of the debugger.
* Only attempt driver install after opening the transport fails with file
not found.
* Add /LARGEADDRESSAWARE to debugger executables (cdb/kd/ntsd/windbg).
* Update vmdemux tool
* Fix pdbcopy.exe tool
* "dt" would display enumerant symbolic names for enumeration-typed bit-
field members.
* Make "dt" member field match case-insensitive.
* Support wildcard module name in "dt" command. For example, "dt
adv!*RegQuery*".
* "dt/dv" would output more information indicating that this is an empty
string (the default display "") or this is memory read failure (new output
"--- memory read error at address ...").
* "sx? ud" commands can now use an image name (for example, ntdll.dll) as
well as a module name (ntdll).
* Fix ".dbgdbg" command failure when debugger is installed in a directory
that contains spaces (for example, "c:\Program Files\Debuggers").
* Fix "z" command loop counter reset problem.
* Debugger extension would be loaded using LOAD_WITH_ALTERED_SEARCH_PATH
so that dependent binaries could be loaded from the same directory where
loaded extension resides (and the directory is not part of search path).
* "!defwrites" (in kdexts.dll) will not query nt!MmThrottleTop and
nt!MmThrottleBottom values in Windows Vista.
* Fix for "!sysinfo cpuinfo".
* Fix for "!sysinfo gbl" infinite loop problem.
* Fix for DisplayFlags() has output string buffer overrun when using
"!handle" (in ntsdexts.dll).
* Fix for "!gflags" command.
* Fix so that "fltkd" and "boot" debugger extensions run on pre-Win7 OS.
* Fix Symstore/SymChk improved detection for resource-only binaries
* Continued on-going improvements to !analyze

Good to know, that you can have multiple versions of windbg on the same machine by simply x-copying it - hope that someday there's no need to write: "I'm still keeping 6.7.5.0"

Thursday, March 06, 2008

Slow symbol loads because of unresolved breakpoints

I was wondering why debugging one specific application took much more time than it used before.
Additionally I always got this suspicious message:

>>
Integrated managed debugging does not support enumeration of symbols.
See http://dbg/managed.htm for more details.
<<

The root cause of the slow down was a unresolved breakpoint that caused searching for a match after each module load.


0:012> bl
0 eu             0001 (0001) (v)

(the u in eu stands for unresolved...)
It is a common illness I'm suffering from to miss the Ctrl button when doing cut and paste. The result is a breakpoint on 'v' :-(

What helped was a simple 'bc*' to clear all breakpoints and I was able to debug at the speed I was used to...

Thursday, February 21, 2008

Shooting the PAGE_GUARD flag with MiniDumpWithIndirectlyReferencedMemory

A colleague of mine (thanks Ralf for pointing this out!) told me that using MiniDumpWithIndirectlyReferencedMemory in MiniDumpWriteDump can cause a nasty crashes.
Following the "in 99.9% of the cases it is your own fault" pattern I suspected the problem to be somewhere else but in dbghelp. Ralf kindly provided me with a sample project which I condensed a bit to fit on a single page:

// GuardPageDump.cpp : Defines the entry point for the console application.
//
#include "stdafx.h"
#include "C:/Program Files/Debugging Tools for Windows/sdk/inc/dbghelp.h"
#pragma comment( lib, "C:/Program Files/Debugging Tools for Windows/sdk/lib/i386/dbghelp.lib")

#include "process.h"

void
BigFunc ()
{

char
sBigBuffer [20000] = {'\0'};
printf ("BigFunc was called!\nsBigBuffer: %s\n",sBigBuffer);
}


void
ProblemFunc(HANDLE hWaitForMe)
{

char
sDummy1[] = {'A','\0'};

unsigned long
iDummy = reinterpret_cast<unsigned long>(&(sDummy1[0]));

// let iDummp seem like a pointer pointing to the guarded page
iDummy -= 0x2000;
printf ("Integer value: %d\n", iDummy);

//make sure the integer value pointing to the guard page area is on the stack, when MiniDumpWriteDump is called from another stack
//during wait we will issue a dump creation on the main thread
WaitForSingleObject(hWaitForMe,INFINITE);

printf ("Calling BigFunc crashes since stack can no longer be extended\n");

BigFunc();

printf ("Integer value: %d\n", iDummy);
}


void
ProblemFuncThread(void * p)
{

ProblemFunc(reinterpret_cast<HANDLE>(p));
_endthread();
}


int
_tmain(int argc, _TCHAR* argv[])
{

printf ("This program demonstrates the damaging effect of creating a userdump with MiniDumpWithIndirectlyReferencedMemory\n");

HANDLE hWaitForMe = CreateEvent(NULL,FALSE,FALSE,NULL);

printf ("Calling ProblemFunc on a different thread\n");
uintptr_t hThread = _beginthread(ProblemFuncThread,0,hWaitForMe);
// give the thread time to start
::Sleep(1000);

printf ("Creating a userdump of type MiniDumpWithIndirectlyReferencedMemory\n");
printf ("Resets guard page flag on the page pointed to by iDummy\n");
HANDLE hFile = CreateFile(_T("c:\\temp\\test_indirect.dmp"), GENERIC_READ | GENERIC_WRITE, 0, NULL, CREATE_ALWAYS, FILE_ATTRIBUTE_NORMAL, NULL );
MiniDumpWriteDump(GetCurrentProcess(),GetCurrentProcessId(),hFile,(MINIDUMP_TYPE) (MiniDumpWithIndirectlyReferencedMemory),0,0,0);

CloseHandle(hFile);

SetEvent(hWaitForMe);
CloseHandle(hWaitForMe);

WaitForSingleObject(reinterpret_cast<HANDLE>(hThread),INFINITE);
return
0;
}


This sample assumes you have installed Debugging Tools for Windows to the default location (C:/Program Files/Debugging Tools for Windows) and you have selected to install the SDK as well.

I'm setting two breakpoints: One on the line that is calling MiniDumpWriteDump - another on the line before calling BicFunc.

First let's have a look at the state before calling MiniDumpWriteDump:


Switching to thread 001 we will notice the value of iDummy = 0x88df38 on the stack that is waiting:


Now before calling MiniDumpWriteDump let's have a look at the memory layout:

0:001> !vadump

[...]

BaseAddress: 00125000
RegionSize: 00001000
State: 00001000 MEM_COMMIT
Protect: 00000104 PAGE_READWRITE + PAGE_GUARD
Type: 00020000 MEM_PRIVATE

[...]

BaseAddress: 0088d000
RegionSize: 00001000
State: 00001000 MEM_COMMIT
Protect: 00000104 PAGE_READWRITE + PAGE_GUARD
Type: 00020000 MEM_PRIVATE


Ok, there is a PAGE_GUARD flag for each thread...

0:000> ~0s;!teb
[...]
GuardPageDump!wmain+0x91:
00401991 6a00 push 0
TEB at 7ffdf000
[...]
StackLimit: 00126000
[...]
0:000> ~1s;!teb
[...]
ntdll!KiFastSystemCallRet:
771d9a94 c3 ret
TEB at 7ffde000
[...]
StackLimit: 0088e000
[...]

Adding the RegionSize to BaseAddress gives us the StackLimit observed by !teb.

Now comes the clue: iDummy holds the value 0x88df38 (no pointer) that represents an address in the guarded page. Dbghelp does not know by looking at the stack if this is a pointer or value and follows the indirections. Looking at the memory layout after call to MiniDumpWriteDump reveals the problem:
0:001> !vadump
[...]
BaseAddress: 00125000
RegionSize: 00001000
State: 00001000 MEM_COMMIT
Protect: 00000104 PAGE_READWRITE + PAGE_GUARD
Type: 00020000 MEM_PRIVATE

[...]

BaseAddress: 0088d000
RegionSize: 00003000
State: 00001000 MEM_COMMIT
Protect: 00000004 PAGE_READWRITE
Type: 00020000 MEM_PRIVATE

The PAGE_GUARD flag for thread 001 is gone! Now it's just a question of time until your application will crash without giving you any clue on the root cause of the problem:

0:001> g
(13e0.ee4): Access violation - code c0000005 (first chance)
First chance exceptions are reported before any exception handling.
This exception may be expected and handled.
eax=0088c000 ebx=00bc2e30 ecx=0088b100 edx=771d9a94 esi=00000000 edi=00000000
eip=00401a07 esp=0088ff24 ebp=0088ff2c iopl=0 nv up ei pl nz na pe nc
cs=001b ss=0023 ds=0023 es=0023 fs=003b gs=0000 efl=00010206
GuardPageDump!_chkstk+0x27:
00401a07 8500 test dword ptr [eax],eax ds:0023:0088c000=????????

0:001> g
(13e0.ee4): Access violation - code c0000005 (!!! second chance !!!)


Next thing I will do is to tell Microsoft about this. Meanwhile I'll try to restore the PAGE_GUARD flag as a workaround fix using VirtualProtext but I'm not sure if this is really a good idea.

BTW: I've tested this the latest version of dbghelp.dll I know:
A colleague of mine recently investigated a crash that could be deducted to the usage of MiniDumpWriteDump along with MiniDumpWithIndirectlyReferencedMemory flag. The problem is, that MiniDumpWriteDump clears the PAGE_GUARD flag if a value or pointer is on the a stack other than the stack that calls MiniDumpWriteDump.
As a result the process will crash later if the stack needs to be extended.
I've described the problem in detail here:
http://voneinem-windbg.blogspot.com/2008/02/shooting-pageguard-flag-with.html

I would be nice to see fix for this, because the MiniDumpWithIndirectlyReferencedMemory is really useful.
I didn't investigate into the other flags of MINIDUMP_TYPE Enumeration but MiniDumpNormal and MiniDumpWithFullMemory seem to work without a problem.

I've been testing this with the latest public version of dbghelp.dll
0:001> lmvm dbghelp
start end module name
68af0000 68c05000 dbghelp (deferred)
Image path: C:\Users\voneinem\Documents\Visual Studio 2008\Projects\GuardPageDump\Release\dbghelp.dll
Image name: dbghelp.dll
Timestamp: Thu Sep 27 23:27:05 2007 (46FC2029)
CheckSum: 0010087A
ImageSize: 00115000
File version: 6.8.4.0
Product version: 6.8.4.0

Wednesday, February 13, 2008

Digging into Kernel Space

The company I am working for manufactures a laboratory device that is getting conntected via RS232 interface. As many laptop computers today do not have such an interface we must provide our customers with a good solution how to operate their instruments in such an environment. Therefore we identified a USB to RS232 adapter as a good solution and selected a cable with prolific chipset PL-2303HX and drivers.

Lately I have seen sporadic cases of strange process hangs. The process that in writing into RS232 is stuck. I was able to attach windbg to that process and quickly realized that it was hanging in a call to Kernel32!WriteFile. As we are setting com timeouts via kernel32!SetCommTimeouts to 10 seconds in the worst case I would have expected the function to return in any case. This did not happen :-(

Strange enough, killing the process was not possible anymore. No Task Manager, no Process Explorer and no kill -f was working. Finally I wasn't even able to shut down the system properly (XP SP2) and needed to kill it the hard way.

OK I could not do anything more in user mode space that saying WriteFile is the bad guy. This is a bad explanation for customers. They want the system to work - regardless of how is the culprit.

So I was entering new spaces - the kernel space...

First task was to get a dump. OSR Online offers a tool called Bang which did the job.
Before I needed to configure the system to generate a full dump. Therefore right click on computer and select properties. Go to the advanced tab and click on Settings for Startup and recovery. In the 'Write debugging information' frame select 'Complete memory dump' and the dump file name:


Finish with OK and now start the Bang.exe (it seems to require a local admin account - so I used the runas...):


It is not hard to hit the nice red button and you'll see a nice blue screen ;-)

After reboot the promised memory.dmp was available.

But what next? I'm fully unexperienced in kernel debugging and I tried the 'poking around until you find something' pattern without success. Fortunately I have a MSDN subscription that offers two free support incidents. So I went to Bill and told him that I'm not happy with this. He said, please give me the dump and I'll see. Then he said it'll take songer than a day but not much. Finally took nearly tree weeks - never mind ;-)
I got the dump analysis out of Microsoft hands and this was pretty much pointing to the place I suspected (the USB to RS232 driver). Additionally he said that my process was accessing the same port from two different threads. This touched my pride as a developer and I needed to understand the magic bill was doing my dump. Finally I discovered that it was quite true as the two threads were accessing two different ports (I had in sum 4 ports on the system) - but that's forgiven.

Now to the internals of the kernel dump analyis:

I know the name of the hanging process. So first we need to get the processes:
0: kd> !process 0 0
[...]
PROCESS 820f4838 SessionId: 0 Cid: 01d4 Peb: 7ffd8000 ParentCid: 0608
DirBase: 02a00440 ObjectTable: e4b36400 HandleCount: 209.
Image: MyProcess.exe
[...]


Now we need to get the details of the process:
0: kd> !process 820f4838 f
PROCESS 820f4838 SessionId: 0 Cid: 01d4 Peb: 7ffd8000 ParentCid: 0608
DirBase: 02a00440 ObjectTable: e4b36400 HandleCount: 209.
Image:
MyProcess.exe
VadRoot 81b9ffa8 Vads 288 Clone 0 Private 61253. Modified 84841. Locked 0.
DeviceMap e4c3b450
Token e4c02030
ElapsedTime 1 Day 04:24:53.014
UserTime 00:00:23.156
KernelTime 00:00:20.000
QuotaPoolUsage[PagedPool] 156580
QuotaPoolUsage[NonPagedPool] 12612
Working Set Sizes (now,min,max) (25572, 50, 345) (102288KB, 200KB, 1380KB)
PeakWorkingSetSize 52956
VirtualSize 372 Mb
PeakVirtualSize 379 Mb
PageFaultCount 203878
MemoryPriority BACKGROUND
BasePriority 8
CommitCharge 63188
DebugPort 81905360

THREAD 81a81020 Cid 01d4.0c20 Teb: 7ffaf000 Win32Thread: e397ceb0 WAIT: (DelayExecution) KernelMode Non-Alertable
81a81110 NotificationTimer
IRP List:
816ecde0: (0006,0220) Flags: 00000a30 Mdl: 00000000
Not impersonating
DeviceMap e4c3b450
Owning Process 820f4838 Image:
MyProcess.exe
Wait Start TickCount 6562217 Ticks: 0
Context Switch Count 408541 LargeStack
UserTime 00:00:00.109
KernelTime 00:00:00.421
Win32 Start Address 0x77c3a341
Start Address 0x7c810659
Stack Init a9910000 Current a990fc04 Base a9910000 Limit a990d000 Call 0
Priority 10 BasePriority 10 PriorityDecrement 0 DecrementCount 16
ChildEBP RetAddr
a990fc1c 80502e56 nt!KiSwapContext+0x2f (FPO: [Uses EBP] [0,0,4])
a990fc28 804faa13 nt!KiSwapThread+0x8a (FPO: [0,0,0])
a990fc54 8057ca62 nt!KeDelayExecutionThread+0x1c9 (FPO: [Non-Fpo])
a990fc78 8057e7ff nt!IopCancelAlertedRequest+0x52 (FPO: [Non-Fpo])
a990fc94 8057c341 nt!IopSynchronousServiceTail+0xe1 (FPO: [Non-Fpo])
a990fd38 805409ac nt!NtWriteFile+0x5d7 (FPO: [Non-Fpo])
a990fd38 7c90eb94 nt!KiFastCallEntry+0xfc (FPO: [0,0] TrapFrame @ a990fd64)
WARNING: Frame IP not in any known module. Following frames may be wrong.
0208fd70 00000000 0x7c90eb94

THREAD 8169da90 Cid 01d4.0ef0 Teb: 7ff9f000 Win32Thread: 00000000 WAIT: (DelayExecution) KernelMode Non-Alertable
8169db80 NotificationTimer
IRP List:
816b3710: (0006,0220) Flags: 00000a30 Mdl: 00000000
Not impersonating
DeviceMap e4c3b450
Owning Process 820f4838 Image:
MyProcess.exe
Wait Start TickCount 6562217 Ticks: 0
Context Switch Count 64786
UserTime 00:00:00.000
KernelTime 00:00:00.000
Win32 Start Address 0x77c3a341
Start Address 0x7c810659
Stack Init a9a5c000 Current a9a5bc04 Base a9a5c000 Limit a9a59000 Call 0
Priority 6 BasePriority 6 PriorityDecrement 0 DecrementCount 0
ChildEBP RetAddr
a9a5bc1c 80502e56 nt!KiSwapContext+0x2f (FPO: [Uses EBP] [0,0,4])
a9a5bc28 804faa13 nt!KiSwapThread+0x8a (FPO: [0,0,0])
a9a5bc54 8057ca62 nt!KeDelayExecutionThread+0x1c9 (FPO: [Non-Fpo])
a9a5bc78 8057e7ff nt!IopCancelAlertedRequest+0x52 (FPO: [Non-Fpo])
a9a5bc94 8057c341 nt!IopSynchronousServiceTail+0xe1 (FPO: [Non-Fpo])
a9a5bd38 805409ac nt!NtWriteFile+0x5d7 (FPO: [Non-Fpo])
a9a5bd38 7c90eb94 nt!KiFastCallEntry+0xfc (FPO: [0,0] TrapFrame @ a9a5bd64)
WARNING: Frame IP not in any known module. Following frames may be wrong.
04dcfd9c 00000000 0x7c90eb94

Here we can see the two hanging threads in NtWriteFile I already have seen in user space.

I also was able to go that far without Bill's help - now comes the special magic:
The key to the success is lying in the IRP ( I/O request packet) list!

So let's have at the details of the IRPs:
1: kd> !irp 816ecde0
Irp is active with 5 stacks 5 is current (= 0x816ecee0)
No Mdl: System buffer=81e316a8: Thread 81a81020: Irp stack trace.
cmd flg cl Device File Completion-Context
[...]
>[ 4, 0] 0 1 81e36040 81ca1798 00000000-00000000 pending
*** ERROR: Module load completed but symbols could not be loaded for ser2pl.sys
\Driver\Ser2pl
Args: 00000002 00000000 00000000 00000004
1: kd> !irp 816b3710
Irp is active with 5 stacks 5 is current (= 0x816b3810)
No Mdl: System buffer=821b62f0: Thread 8169da90: Irp stack trace.
cmd flg cl Device File Completion-Context
[...]
>[ 4, 0] 0 1 81e37040 81e06a78 00000000-00000000 pending
\Driver\Ser2pl
Args: 00000001 00000000 00000000 00000004

In both cases it is the Ser2pl driver (from prolific) that it not working it's queue with status pending.

But now to Bill statement that two threads are accessing the same port:
Let's see were the data is directed to:

1: kd> !object 81e36040
Object: 81e36040 Type: (823b1958) Device
ObjectHeader: 81e36028 (old version)
HandleCount: 0 PointerCount: 3
Directory Object: e10023d0 Name:
Serial3

1: kd> !object
81e37040
Object: 81e37040 Type: (823b1958) Device
ObjectHeader: 81e37028 (old version)
HandleCount: 0 PointerCount: 3
Directory Object: e10023d0 Name:
Serial2

Finally we can get the port mapping:
1: kd> !object \GLOBAL??
[...]
08 e1632920 SymbolicLink COM2
[...]
e1789a58 SymbolicLink COM3
[...]
e37b2e40 SymbolicLink COM4
[...]
e383d438 SymbolicLink COM5

1: kd> !object e1632920
Object: e1632920 Type: (823ed398) SymbolicLink
ObjectHeader: e1632908 (old version)
HandleCount: 0 PointerCount: 1
Directory Object: e1000788 Name: COM2
Target String is '\Device\Serial0'
1: kd> !object e1789a58
Object: e1789a58 Type: (823ed398) SymbolicLink
ObjectHeader: e1789a40 (old version)
HandleCount: 0 PointerCount: 1
Directory Object: e1000788 Name:
COM3
Target String is '\Device\
Serial2'
1: kd> !object e37b2e40
Object: e37b2e40 Type: (823ed398) SymbolicLink
ObjectHeader: e37b2e28 (old version)
HandleCount: 0 PointerCount: 1
Directory Object: e1000788 Name:
COM4
Target String is '\Device\
Serial3'
1: kd> !object e383d438
Object: e383d438 Type: (823ed398) SymbolicLink
ObjectHeader: e383d420 (old version)
HandleCount: 0 PointerCount: 1
Directory Object: e1000788 Name: COM5
Target String is '\Device\Serial4'


So one thread was writing on to COM3 and the other to COM4. I was a bit less concerned that it was not obviously my fault but of course the problem is not gone. Now I hope to get fix from the cable supplier or select different hardware.
I must say I learned a lot with this case but it is not the type of issue I'm begging for!

BTW: after all this investigations I found post on Marks blog about this class of defect: Unkillable Processes

Finally a big thanks to Microsoft Support!

Tuesday, February 12, 2008

Getting the GCRoot on a range of objects

Recently I was in the situation to look at the GCRoot of a bunch of objects in a range.
Eran posted on how to do this taks for getting detailed object information. I used this as a template for my needs:

.foreach (obj { !DumpHeap -short start_address end_address }) { !GCRoot ${obj} }

Now replace start_address and end_address with your adresses...

Friday, February 08, 2008

Rank four on Google for my Blog?

Today I was curious and just googled for windbg.
Surprisingly I noticed, that my blog got rank 4:


I do not understand this, because there are lots of blogs (Tess, Dimtry, John just to name three of the best) outside that earn a much higher ranking than this one. The primary intent of this blog was to extend my brain which unfortunately is easily loosing things over time. So if you should hit my blog just googling for windbg make sure to visit the blogs on my roll...

BTW: Tess is currently conducting an online training on windbg. Check it out...

Thursday, January 31, 2008

Setting multiple breakpoints via wildcard pattern

Sometimes I need a break point on a specific funtion in multiple classes. Examples are the use of templates, interfaces or inheritence.

This can be easily achived via the bm (I translate as break match).

Example:

bm /a MyModule!!CComCollectionMap*::*get_Exists*


This will set a deferred breakpoint on every function that matches the given expression.
It is a good idea to check the matches upfront with the following expression:

x MyModule!!CComCollectionMap*::*get_Exists*

In order to clear all currently set break points use:

bc *

For more details refer to the very good Online Help under "bp, bu, bm (Set Breakpoint)"

Wednesday, January 30, 2008

List source lines at current scope ip

To list the source at the currently selected frame (which can be set by either the .frame command or by clicking into the call stack window) use the lsa (List Source Lines) command:

0:000> lsa @$scopeip
578:
579: ' Setting device name
580: If (gPrintContext.strPrinter = "") Then
581: If (rpt.Printer.NDevices > 0) Then
> 582: gPrintContext.strPrinter = rpt.Printer.DeviceName
583: ' "Device Name is empty hence setting it to the default printer."
584: Else
585: ' the .PageSetup will show the system message
586: ' "No printer installed."
587: End If


Monday, January 28, 2008

Google Custom Search for WinDbg

I often came across the point where I needed to search the web for a common phrases used in very special technical manner. One example is sos or son of strike. If you simply search for sos you will get everything but not what you are interested in.

For getting help finding the needle in the hay when it comes to windbg I created a Google Custom Search Engine for windbg.

You can find the CSE here or directly on my page here:


If you have additional sites for me to add, please drop a comment here....

Thursday, January 24, 2008

CoCreateInstance: Which object in which dll

I came across a process that was consuming statically 25% CPU which I didn't understand why.
So I attached windbg and issued

0:004> !runaway
User Mode Time
Thread Time
4:328 0 days 0:07:22.015
0:2a0 0 days 0:00:25.078
5:228 0 days 0:00:00.000
3:324 0 days 0:00:00.000
2:320 0 days 0:00:00.000
1:31c 0 days 0:00:00.000

So switch to that thread

0:004> ~4 s

And issue a stack dump:

0:004> kb 100
ChildEBP RetAddr Args to Child
[...]
010be7a0 77f6946c 010bec5c 00000000 00000401 ole32!CoCreateInstance+0x37
[...]
010bfe7c 0052770f 010bfe98 010bfee0 0052773f shell32!ShellExecuteExA+0x203


So I had two questions:

1.) Which process should be launched by ShellExecute
2.) Which object should be created by CoCreateInstance

ad 1.) First param passed to ShellExecute is of type LPSHELLEXECUTEINFO
dt _SHELLEXECUTEINFO 010bfe98 didn't work for me although having symbol server setup correctly. So I needed the fifth pointer in the struct:

0:004> dda 010bfe98

did the job:
010bfe98 0000003c
010bfe9c 00000440
010bfea0 00000000
010bfea4 00527768 "open"
010bfea8 00527758 "Viewer.exe" <== 010bfeac 00000000

ad 2.) First param passed is of type REFCLSID or GUID
Then I got it via:
0:004> dt ntdll!_GUID 010bec5c
{871c5380-42a0-1069-a2ea-08002b30309d}
+0x000 Data1 : 0x871c5380
+0x004 Data2 : 0x42a0
+0x006 Data3 : 0x1069
+0x008 Data4 : [8] "???"

Now use either regedit or more elegantly:
0:005> !dreg hkcr\CLSID\{871C5380-42A0-1069-A2EA-08002B30309D}\InProcServer32\!*
Value: "" - REG_EXPAND_SZ: "%SystemRoot%\system32\shdocvw.dll"
expanded = "C:\WINDOWS\system32\shdocvw.dll"
------------------------------------------------------------------------
Value: "ThreadingModel" - REG_SZ: "Apartment"
------------------------------------------------------------------------

That's it!

Thursday, January 17, 2008

Setting a thread sensitive Breakpoint

I just came across the problem that I needed to break at a function just in case this function is executed in one specific thread.

In Visual Studio 2008 (and also earlier) you can achieve this via Breakpoint filters:
1.) Right click on the Breakpoint and click on Filter...


2.) Now specify the thread id you want to break in...


In windbg you can achieve it like this:

Instead of typing:

bp MyModule!MyClass::MyFunction+MyOffset


type:
~ 13 bp MyModule!MyClass::MyFunction+MyOffset

to break in just if this function is executed in thread with id 13

Wishlist: Writing Debugger extension program in C#

In xqiu's blog I found an interesting post about Writing Debugger extension program in C# . Unfortunately the mentioned mdbeng.dll is not public yet. I contacted the Debugger Team with the wish to get it. Let's see what comes...

Tuesday, October 30, 2007

Failed to load data access DLL, 0x80004005 - hm

Me and some colleagues of mine recently all stumbled over the following error when analyzing .NET minidumps:
I opened a the minidump and typed !CLRStack. What I got was:

Failed to load data access DLL, 0x80004005
Verify that 1) you have a recent build of the debugger (6.2.14 or newer)
2) the file mscordacwks.dll that matches your version of mscorwks.dll is
in the version directory
3) or, if you are debugging a dump file, verify that the file
mscordacwks___.dll is on your symbol path.
4) you are debugging on the same architecture as the dump file.
For example, an IA64 dump file must be debugged on an IA64
machine.

You can also run the debugger command .cordll to control the debugger's
load of mscordacwks.dll. .cordll -ve -u -l will do a verbose reload.
If that succeeds, the SOS command should work on retry.

If you are debugging a minidump, you need to make sure that your executable
path is pointing to mscorwks.dll as well.


OK, so I followed the step 1 through 4...
ad 1) I'm using version 6.7.5.0 for good reasons
ad 2) Don't know what that means...
ad 3) Why should a dll be in my symbol path?!?
ad 4) The architecture is x86_32 on both machines

So I tried .cordll -ve -u -l

0:000> .cordll -ve -u -l
CLRDLL: Unknown processor type in image C:\WINDOWS\Microsoft.NET\Framework\v2.0.50727\mscorwks.dll
CLR DLL status: No load attempts

The following sentence finally helped me:

If you are debugging a minidump, you need to make sure that your executable
path is pointing to mscorwks.dll as well.

So I executed:

0:000> lmv m mscorwks
start end module name
79e70000 7a3d6000 mscorwks T (pdb symbols) C:\windbg\symbols\mscorwks.pdb\6D3E0DE91A284256A48A60718DC9CDEB2\mscorwks.pdb
Loaded symbol image file: mscorwks.dll
Image path: C:\WINDOWS\Microsoft.NET\Framework\v2.0.50727\mscorwks.dll
Image name: mscorwks.dll
Timestamp: Fri Apr 13 09:15:54 2007 (461F2E2A)
CheckSum: 005635C7
ImageSize: 00566000
File version: 2.0.50727.832
Product version: 2.0.50727.832
File flags: 0 (Mask 3F)
File OS: 4 Unknown Win32
File type: 2.0 Dll
File date: 00000000.00000000
Translations: 0000.04b0 0000.04e0 0409.04b0 0409.04e0

And...

0:000> .exepath+ C:\WINDOWS\Microsoft.NET\Framework\v2.0.50727\

Finally...

0:000> .reload
...................................................................................................................................................................................................................................................
CLRDLL: Loaded DLL C:\WINDOWS\Microsoft.NET\Framework\v2.0.50727\mscordacwks.dll

And my !CLRStack worked ;-)

Thursday, October 25, 2007

SOSAssist >> Toolbox

Tess mentioned in her recent post '.NET Finalizer Memory Leak: Debugging with sos.dll in Visual Studio' a tool named SOSAssis written by Ingo Rammer. I was curious, clicked on the link and looked at the screenshots.
I couldn't believe that there is a tool out there that eases .NET production debugging in such a way. If you ever walked down the objects tree via sos commands you will get tears in your eyes when you look at the Stack Objects window!!!


[click to enlarge...]

I googled for sosassist and rammer and just got 4 relevant hits?!

So I needed to update on this after my very first look at the tool as I'm totally amazed! This thing should be in the toolbox of every .NET developer.

Next I will follow up on this tool soon with more experiences.

Tuesday, October 23, 2007

Windbg version 6.8.4.0 is out (I'm still keeping 6.7.5.0)

Microsoft released a new version of Debugging Tools for Windows (containing Windbg). The Highlights in Version 6.8.4.0 are very roughly described. Still the integrated .NET Support that came up with version 6.7.5.0 by accident (see Pat Styles [MSFT] comment in this post) is not available.
Luckily different versions of windbg can be installed side by side (via XCopy) and I'm keeping my 6.7.5.0 for managed debugging as it works pretty well.

Monday, August 13, 2007

Symbol table tab completion

I just stumbled over a feature which is either new or I didn't realize before.
It is support of tab completion in the command window.

When I'm going to set a breakpoint I normall execute an 'x' command with a good guess about the signature:
E.g. :

x kernel32!*ToWideChar

Giving:
7c809bf8 kernel32!MultiByteToWideChar =

Then I can set the breakpoint either by:
bp 7c809bf8
or
bp kernel32!MultiByteToWideChar

Now by accident (I'm used to that from the console) I wrote just a few letters and pressed the tab key and surprise windbg did the rest ;-)

Try the following:

1.) bp ker<2*tab> gives bp kernel32!
2.) bp kernel32!Mul gives bp kernel32!MultiByteToWideChar
3.) and the breakpoint is set

Those little enhancements can significantly make your life easier.

I observed it with windbg 6.7.5.1. Please tell me if it was there before and I'm telling old stories.

Cheers,
Volker

...

Monday, July 09, 2007

First look at windbg 6.7.5.1 disappointing

As Dmitry just mentioned a new version of windbg, I downloaded and installed it. I was curious, if the new version will provide better support for managed dumps as i could see big improvements in the last version.

So I loaded my standard managed crash dump file and...
where version 6.7.5.0 delivered nicely the stack by 'k':

0:000> k *** Stack trace for last set context - .thread/.cxr resets itChildEBP RetAddr 0012f094 00db0581 Demo1!Demo1._FormDemo1.ItsNorMe()+0x44 [E:\My Projects\TechChannel\Demo1\Demo1\Form1.cs @ 36]0012f094 00db054d Demo1!Demo1._FormDemo1.ItsNeitherMe()+0x19 [E:\My Projects\TechChannel\Demo1\Demo1\Form1.cs @ 28]0012f094 7b060a6b Demo1!Demo1._FormDemo1.button1_Click(System.Object, System.EventArgs)+0x1d [E:\My Projects\TechChannel\Demo1\Demo1\Form1.cs @ 23]0012f094 7b105379 System_Windows_Forms_ni!System.Windows.Forms.Control.OnClick(System.EventArgs)+0x570012f094 7b10547f System_Windows_Forms_ni!System.Windows.Forms.Button.OnClick(System.EventArgs)+0x490012f094 7b0d02d2 System_Windows_Forms_ni!System.Windows.Forms.Button.OnMouseUp(System.Windows.Forms.MouseEventArgs)+0xc30012f094 7b072c74 System_Windows_Forms_ni!System.Windows.Forms.Control.WmMouseUp(System.Windows.Forms.Message ByRef, System.Windows.Forms.MouseButtons, Int32)+0xf20012f100 7b0815a6 System_Windows_Forms_ni!System.Windows.Forms.Control.WndProc(System.Windows.Forms.Message ByRef)+0x5440012f13c 7b0814c3 System_Windows_Forms_ni!System.Windows.Forms.ButtonBase.WndProc(System.Windows.Forms.Message ByRef)+0xce0012f19c 7b07a72d System_Windows_Forms_ni!System.Windows.Forms.Button.WndProc(System.Windows.Forms.Message ByRef)+0x2b0012f19c 7b07a706 System_Windows_Forms_ni!System.Windows.Forms.Control+ControlNativeWindow.OnMessage(System.Windows.Forms.Message ByRef)+0xd0012f19c 7b07a515 System_Windows_Forms_ni!System.Windows.Forms.Control+ControlNativeWindow.WndProc(System.Windows.Forms.Message ByRef)+0xd60012f19c 00342124 System_Windows_Forms_ni!System.Windows.Forms.NativeWindow.Callback(IntPtr, Int32, IntPtr, IntPtr)+0x75WARNING: Frame IP not in any known module. Following frames may be wrong.0012f1c0 7e418734 0x3421240012f1ec 7e418816 user32!InternalCallWinProc+0x280012f254 7e4189cd user32!UserCallWinProcCheckWow+0x1500012f2b4 7e418a10 user32!DispatchMessageWorker+0x3060012f2c4 00f20e4e user32!DispatchMessageW+0xf0012f2e0 7b084766 CLRStub[StubLinkStub]@f20e4e0012f398 7b08432d System_Windows_Forms_ni!System.Windows.Forms.Application+ComponentManager.System.Windows.Forms.UnsafeNativeMethods.IMsoComponentManager.FPushMessageLoop(Int32, Int32, Int32)+0x2ea

I now get this with the new version:

0:000> k *** Stack trace for last set context - .thread/.cxr resets itChildEBP RetAddr WARNING: Frame IP not in any known module. Following frames may be wrong.0012f094 7b072c74 0xdb05dc0012f100 7b0815a6 System_Windows_Forms_ni+0xa2c740012f13c 7b0814c3 System_Windows_Forms_ni+0xb15a60012f1c0 7e418734 System_Windows_Forms_ni+0xb14c30012f1ec 7e418816 user32!InternalCallWinProc+0x280012f254 7e4189cd user32!UserCallWinProcCheckWow+0x1500012f2b4 7e418a10 user32!DispatchMessageWorker+0x3060012f2c4 00f20e4e user32!DispatchMessageW+0xf0012f2e0 7b084766 0xf20e4e0012f398 7b08432d System_Windows_Forms_ni+0xb47660012f408 7b08416b System_Windows_Forms_ni+0xb432d0012f438 7b0c69fe System_Windows_Forms_ni+0xb416b0012f480 79e88f63 System_Windows_Forms_ni+0xf69fe0012f490 79e88ee4 mscorwks!CallDescrWorker+0x330012f510 79e88e31 mscorwks!CallDescrWorkerWithHandler+0xa30012f650 79e88d19 mscorwks!MethodDesc::CallDescr+0x19c0012f668 79e88cf6 mscorwks!MethodDesc::CallTargetWorker+0x200012f67c 79f084b0 mscorwks!MethodDescCallSite::Call+0x180012f7e0 79f082a9 mscorwks!ClassLoader::RunMain+0x2200012fa48 79f0817e mscorwks!Assembly::ExecuteMainMethod+0xa6


Needless to say that the 'Calls' window does show the same and there is no click on a frame that brings to directly to the sources :-(

'!DumpStack -ee' still works, but this didn't change...

Resume: I will try the see the new improvements but I will not uninstall 6.7.5.0!


Monday, June 25, 2007

Scan the full process memory for a pattern

Very often I need to scan the process memory for a specific pattern.
This can be either a pointer or a string or whatever and I want to find out, which other memory references this pointer or pattern.

Simply type ''s -d 0x00000000 L?0xffffffff ' to find a referenced pointer on a x32 architecture.

E.g.:

0:000> s -d 0x00000000 L?0xffffffff 30c5bf9c
0012b2b0 30c5bf9c 00000000 00000000 00000000 ...0............
0012b2f8 30c5bf9c 9955d404 0badf00d 3e4d1f74 ...0..U.....t.M>
0012b340 30c5bf9c 3e4d1f70 9955d450 0badf00d ...0p.M>P.U.....
0012b374 30c5bf9c 3e4d1f70 9955d49c 00000001 ...0p.M>..U.....
3e4d1f7c 30c5bf9c 00000000 00000000 00000001 ...0............
3e4d1f90 30c5bf9c 00000000 00000000 00000000 ...0............
3e4d1fd0 30c5bf9c 30c5bf9c 00000000 00000001 ...0...0........
3e4d1fd4 30c5bf9c 00000000 00000001 33522fc0 ...0........./R3


The first column lists the locations that matched the pattern.

For more information refer to windbg online help: s (Search Memory)