Google Alerts on keyword 'windbg' delivered me an interesting new blog hosted by the Microsoft Critical Problem Resolution (CPR) Platforms Team. Especially the article 'This button doesn’t do anything!' got my interest as I needed to do nearly the same thing some days ago. This will definitely go onto by blog roll.
Monday, June 18, 2007


Getting VB6 Err Object from a dump
Once again (sigh) looking at vb6 crash dumps I found this very interesting article from Matt Adamson about Visual Basic Production Debugging. He did a great job reversing data structures used by VB6 error handling. When you need to get the VB6 Err Object information from a crash dump you should read it!
Wednesday, May 30, 2007
John Robbins blogged me!
John Robbins, the author of the must read book 'Debugging .NET 2.0 Applications', blogged me in his latest post :-)
I was very excited to read, that he considered my blog as 'excellent'. But I must say, that I have a different understanding about this adjective.
First I must say that Johns book is 'excellent' and every developer should read it, beacuse it's not just about fixing what is already broken, it's very focused on avoiding errors in the first place.
Secondly, if you want to read an 'excellent' blog about windbg goto Tess. This blog is 'excellent'.
Finally this might be a matter of culture. I think my blog is something away from 'excellent', but I hope some day I get near to it. I'm a european and we seem to have a different scale ;-)
Tuesday, May 29, 2007
Creating and analyzing minidumps in .NET production applications (continued)
In my previous post I delivered a small receipt how to create and analyze minidumps from .NET applications. Then I discovered that version 6.7.5.0 of windbg shows some nice integrations of sos. Now, I was curious if the same integration also works for crash dumps and it does:
Opening a crash dump and processing .ecxr brings me directly to the source code line, without much peeking and poking:
Tuesday, May 15, 2007
Oh Borland, oh Microsoft, oh boy
What a wonderful world would it be, if you could develop your applications just on a single frameworks. Reality looks different. Me and many others need to cope with applications constructed from MSVC + or - MFC, VB6, Borland C++ and/or Delphi and other frameworks.
At first it looks like there is a more or less seamless integration possible. Later you discover all those little nasty glitches. In this post I will cover one of those glitches I really didn't know how to solve it but were I finally found a strange solution which I want to share.
To demonstrate the problem create a small C# application like this:
namespace CLRvsBorland
{
static class Program
{
[DllImport("kernel32.dll", CharSet = CharSet.Auto)]
static extern IntPtr LoadLibrary(string lpFileName);
static void Main()
{
IntPtr res = LoadLibrary(@"CC3250MT.DLL");
//try
//{
//// Throw an exception..
//throw new Exception();
//}
//catch
//{
//// .. and just catch it
//}

Double a1 = Double.NaN;
MessageBox.Show("Doh" + a1.CompareTo(Double.NaN).ToString());
}
}
}
When you start it in the debugger, you will get the following exception at instruction 'a1.CompareTo(Double.NaN)':
System.ArithmeticException was unhandled
Message="Overflow or underflow in the arithmetic operation."
Source="mscorlib"
StackTrace:
at System.Double.CompareTo(Double value)
[...]
at System.Threading.ThreadHelper.ThreadStart()
Now remove the comments - and surprise - it works!
I don't know, how it works. I assume it has to do with the order of jit-ing.
Explanations are highly wellcome ;-)
Update: Explanation found! Please have a look into the first 2 comments.
Wednesday, May 02, 2007
Calling functions and methods
Great article from Raymond Chen about calling functions and methods in a windbg debugging session. Must read!
http://blogs.msdn.com/oldnewthing/archive/2007/04/27/2292037.aspx
Friday, April 27, 2007
Windbg 6.7.5.0 released
A long awaited new release of windbg is available.
http://www.microsoft.com/whdc/devtools/debugging/installx86.mspx
The greates thing, I observed so far, is the embedded support of SOS which I didn't see in the new features list. There is no direct need to call !CLRStack or !DumpStack as the managed (along with the unmanaged) stack get's listed in the 'Calls' Window ;-)
And I couln't believe - a click on the frame brought me directly to the source code :-) :-) :-)
Only this thing that didn't work is the locals window. Then I get the message:
Integrated managed debugging does not support enumeration of local variables.See http://dbg/managed.htm for more details.
But in microsoft.public.windbg no one (at Microsoft) wanted to comment on this:
http://groups.google.com/group/microsoft.public.windbg/browse_frm/thread/85afed79ee62854f/#
Anyways - I like the new windbg.
Thursday, March 22, 2007
Creating and analyzing minidumps in .NET production applications
Preface:
Identifying the source of an error in production applications can be hard task. There are simple errors that can be reproduced with a 'steps to repeat' receipt. Other errors, that are logged as one time only or sporadic are much more difficult. In order to adress them, you can spent tons of time to find a way to create the bug and possibly you will never succeed. In deep this does not mean that this defect does not exist! It is just a matter of probability until it reoccurs. So it is aimed to catch that thing at the first occurrence and gather as much information as reasonable.
How to setup:
First you must make sure your build creates pdbs for all release binaries. Those need to be checked in or sent to a symbol server.
Next thing to do, is to catch all unhandled exceptions:
AppDomain.CurrentDomain.UnhandledException += new UnhandledExceptionEventHandler(AppDomainUnhandledException); (*)
Application.ThreadException += new System.Threading.ThreadExceptionEventHandler(Application_ThreadException);
(*) needs
[SecurityPermission(SecurityAction.Demand,ControlAppDomain=true)]
In the exception handler, which is ideally ONE function, you need to implement the user notification and the dump generation:
private static void HandleException(Exception ex)
{
if (ex == null)
return;
// ExceptionPolicy.HandleException(ex, "Default Policy");
MessageBox.Show("An unhandled exception occurred, and the application is terminating. For more information, see your Application event log.");
CCLRDump.Dump();
Application.Exit();
}
You will notice two specialities in this function.
One is the commented 'ExceptionPolicy.HandleException(ex, "Default Policy");'. This refers to Exception Handling Application Block which can be greatly combined with this mechanism.
The other thing is "CCLRDump.Dump();" This is a wrapper class around ClrDump (© Oleg Starodumov, 2004 - 2006 ).
The implementation is fairly easy :
[C#]
[Flags]
enum MINIDUMP_TYPE {
MiniDumpNormal = 0x00000000,
MiniDumpWithDataSegs = 0x00000001,
MiniDumpWithFullMemory = 0x00000002,
MiniDumpWithHandleData = 0x00000004,
MiniDumpFilterMemory = 0x00000008,
MiniDumpScanMemory = 0x00000010,
MiniDumpWithUnloadedModules = 0x00000020,
MiniDumpWithIndirectlyReferencedMemory = 0x00000040,
MiniDumpFilterModulePaths = 0x00000080,
MiniDumpWithProcessThreadData = 0x00000100,
MiniDumpWithPrivateReadWriteMemory = 0x00000200,
MiniDumpWithoutOptionalData = 0x00000400,
MiniDumpWithFullMemoryInfo = 0x00000800,
MiniDumpWithThreadInfo = 0x00001000,
MiniDumpWithCodeSegs = 0x00002000,
MiniDumpWithoutManagedState = 0x00004000,
};
[...]
[DllImport("clrdump.dll", CharSet = CharSet.Unicode, SetLastError = true)]
private static extern Int32 CreateDump(Int32 ProcessId, string FileName,
Int32 DumpType, Int32 ExcThreadId, IntPtr ExtPtrs);
[...]
public static void Dump()
{
IntPtr pEP = System.Runtime.InteropServices.Marshal.GetExceptionPointers();
CreateDump(
System.Diagnostics.Process.GetCurrentProcess().Id,
@"C:\temp\test.dmp",
(Int32)MINIDUMP_TYPE.MiniDumpWithFullMemory,
AppDomain.GetCurrentThreadId(),
pEP);
}
Ok, now we have setup everything to catch all the nasty stuff, that can happen in our application.
Analyzing those MiniDumps
[please read this post, before moving on...]
In order to analyze those special minidumps some magic is needed. There are several blog posts, articles, books, etc. about how to deal with Dumps in managed and unmanaged manner. I will list some of them I found very supporting at the end of this post. As the most common question is: "Where is the source of ^%!&@ exception" I will deal with that:
- Open the crash dump in Windbg
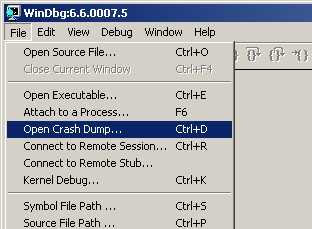
- Make sure you have the correct symbol path (currently no symbol server as 6.6.7.5 has a bad bug with symbol loading - instead use C:\Program Files\Microsoft Visual Studio 8\SDK\v2.0\symbols\) and image path. Type .reload to get the correct symbols.

- Load correct sos (Son of Strike): .loadby sos mscorwks
0:000> .loadby sos mscorwks - !Threads gives you on overview of managed threads (with exceptions)
0:000> !Threads
ThreadCount: 2
UnstartedThread: 0
BackgroundThread: 1
PendingThread: 0
DeadThread: 0
Hosted Runtime: no
ID OSID ThreadOBJ State GC Context Domain Count APT Exception
0 1 1224 001506c0 6020 Enabled 00000000:00000000 0014e808 0 STA System.NullReferenceException (0138fec8)
2 2 153c 00156158 b220 Enabled 00000000:00000000 0014e808 0 MTA (Finalizer) - !pe will dump the last exception on the current thread. Unfortunately this will just give you the function name and not the source line - but with some effort, we can extract this information... For now remember the IP address of the function that threw (we need this later)
0:000> !pe
Exception object: 0138fec8
Exception type: System.NullReferenceException
Message: Object reference not set to an instance of an object.
InnerException:
StackTrace (generated):
SP IP Function
0012EFF0 00DB04AD Demo1._FormDemo1.ItsNorMe()
0012F000 00DB0451 Demo1._FormDemo1.ItsNeitherMe()
0012F008 00DB041D Demo1._FormDemo1.button1_Click(System.Object, System.EventArgs)
0012F018 7B060A6B System.Windows.Forms.Control.OnClick(System.EventArgs)
0012F028 7B105379 System.Windows.Forms.Button.OnClick(System.EventArgs)
0012F034 7B10547F System.Windows.Forms.Button.OnMouseUp(System.Windows.Forms.MouseEventArgs)
0012F058 7B0D02D2 System.Windows.Forms.Control.WmMouseUp(System.Windows.Forms.Message ByRef, System.Windows.Forms.MouseButtons, Int32)
0012F0A4 7B072C74 System.Windows.Forms.Control.WndProc(System.Windows.Forms.Message ByRef)
0012F108 7B0815A6 System.Windows.Forms.ButtonBase.WndProc(System.Windows.Forms.Message ByRef)
0012F144 7B0814C3 System.Windows.Forms.Button.WndProc(System.Windows.Forms.Message ByRef)
0012F14C 7B07A72D System.Windows.Forms.Control+ControlNativeWindow.OnMessage(System.Windows.Forms.Message ByRef)
0012F150 7B07A706 System.Windows.Forms.Control+ControlNativeWindow.WndProc(System.Windows.Forms.Message ByRef)
0012F164 7B07A515 System.Windows.Forms.NativeWindow.Callback(IntPtr, Int32, IntPtr, IntPtr) - !DumpStack will give you full stack trace with all managed and unmanaged frames (pretty large...). In this stack search for "====> Exception cxr@" and remember the return adress (2nd adress from the beginning)
0:000>
0:000> !DumpStack
OS Thread Id: 0x1224 (0)
Current frame: ntdll!KiFastSystemCallRet
ChildEBP RetAddr Caller,Callee
[... lots of stuff ...]
0012eff0 00db04ac (MethodDesc 0xa25aa8 +0x44 Demo1._FormDemo1.ItsNorMe()) ====> Exception cxr@12ed24
[... lots of stuff ...]
0012eff8 00db0451 (MethodDesc 0xa25aa0 +0x19 Demo1._FormDemo1.ItsNeitherMe()), calling 00a264d8
0012f000 00db041d (MethodDesc 0xa25a98 +0x1d Demo1._FormDemo1.button1_Click(System.Object, System.EventArgs)), calling 00a264c4
0012f00c 7b060a6b (MethodDesc 0x7b4a6598 +0x57 System.Windows.Forms.Control.OnClick(System.EventArgs))
0012f020 7b105379 (MethodDesc 0x7b5ab788 +0x49 System.Windows.Forms.Button.OnClick(System.EventArgs)), calling (MethodDesc 0x7b4a6598 +0 System.Windows.Forms.Control.OnClick(System.EventArgs))
0012f02c 7b10547f (MethodDesc 0x7b5ab798 +0xc3 System.Windows.Forms.Button.OnMouseUp(System.Windows.Forms.MouseEventArgs))
0012f050 7b0d02d2 (MethodDesc 0x7b5a59d8 +0xf2 System.Windows.Forms.Control.WmMouseUp(System.Windows.Forms.Message ByRef, System.Windows.Forms.MouseButtons, Int32))
0012f094 7b072c74 (MethodDesc 0x7b5a5a50 +0x544 System.Windows.Forms.Control.WndProc(System.Windows.Forms.Message ByRef)), calling (MethodDesc 0x7b5a59d8 +0 System.Windows.Forms.Control.WmMouseUp(System.Windows.Forms.Message ByRef, System.Windows.Forms.MouseButtons, Int32))
0012f100 7b0815a6 (MethodDesc 0x7b5aba60 +0xce System.Windows.Forms.ButtonBase.WndProc(System.Windows.Forms.Message ByRef)), calling (MethodDesc 0x7b5a5a50 +0 System.Windows.Forms.Control.WndProc(System.Windows.Forms.Message ByRef))
0012f128 7b07a608 (MethodDesc 0x7b5af1c0 +0x48 System.Windows.Forms.Message.Create(IntPtr, Int32, IntPtr, IntPtr)), calling (JitHelp: CORINFO_HELP_GETSHARED_NONGCSTATIC_BASE_NOCTOR)
0012f13c 7b0814c3 (MethodDesc 0x7b5ab7c0 +0x2b System.Windows.Forms.Button.WndProc(System.Windows.Forms.Message ByRef)), calling (MethodDesc 0x7b5aba60 +0 System.Windows.Forms.ButtonBase.WndProc(System.Windows.Forms.Message ByRef))
0012f144 7b07a72d (MethodDesc 0x7b5a8168 +0xd System.Windows.Forms.Control+ControlNativeWindow.OnMessage(System.Windows.Forms.Message ByRef))
0012f148 7b07a706 (MethodDesc 0x7b5a8180 +0xd6 System.Windows.Forms.Control+ControlNativeWindow.WndProc(System.Windows.Forms.Message ByRef)), calling 00a3704e
0012f15c 7b07a515 (MethodDesc 0x7b4a7d60 +0x75 System.Windows.Forms.NativeWindow.Callback(IntPtr, Int32, IntPtr, IntPtr))
[... lots of stuff ...]
0012ffb0 79011b5f mscoree!_CorExeMain+0x2c
0012ffc0 7c816fd7 kernel32!RegisterWaitForInputIdle+0x49 - Now lets unassamble the function that threw (!u
).
You'll get an machine code listing of that function. Now simply search for the second address to remember and there it is.All you need to do is to synchronise machine code with the source code, which is much easier with .NET code compared to C++ code.
0:000> !u 00DB04AD
Normal JIT generated code
Demo1._FormDemo1.ItsNorMe()
Begin 00db0468, size 51
private void ItsNorMe()
{
00db0468 57 push edi
00db0469 56 push esi
00db046a 50 push eax
00db046b 890c24 mov dword ptr [esp],ecx
00db046e 833dc82da20000 cmp dword ptr ds:[0A22DC8h],0
00db0475 7405 je 00db047c
*** WARNING: Unable to verify checksum for mscorlib.ni.dll
*** ERROR: Module load completed but symbols could not be loaded for mscorlib.ni.dll
00db0477 e8821e2e79 call mscorlib_ni+0x221e82 (792e1e82) (mscorlib_ni)
00db047c 33f6 xor esi,esi
00db047e 90 nop
00db047f b9fcf91979 mov ecx,offset mscorlib_ni+0xdf9fc (7919f9fc)
00db0484 e8931bc6ff call 00a1201c (JitHelp: CORINFO_HELP_NEWSFAST)
00db0489 8bf8 mov edi,eax
00db048b 8bcf mov ecx,edi
Listl = new List ();
00db048d e83ea97a78 call mscorlib_ni+0x49add0 (7955add0) (System.Collections.Generic.List`1[[System.Int32, mscorlib]]..ctor(), mdToken: 0600194d)
00db0492 8bf7 mov esi,edi
00db0494 8bce mov ecx,esi
00db0496 ba01000000 mov edx,1
00db049b 3909 cmp dword ptr [ecx],ecx
l.Add(1);
00db049d e8aec77a78 call mscorlib_ni+0x49cc50 (7955cc50) (System.Collections.Generic.List`1[[System.Int32, mscorlib]].Add(Int32), mdToken: 0600195e)
00db04a2 90 nop
l = null;
00db04a3 33f6 xor esi,esi
00db04a5 8bce mov ecx,esi
00db04a7 ba02000000 mov edx,2
00db04ac 3909 cmp dword ptr [ecx],ecx
l.Add(2);
00db04ae e89dc77a78 call mscorlib_ni+0x49cc50 (7955cc50) (System.Collections.Generic.List`1[[System.Int32, mscorlib]].Add(Int32), mdToken: 0600195e)
00db04b3 90 nop
00db04b4 90 nop
00db04b5 59 pop ecx
00db04b6 5e pop esi
00db04b7 5f pop edi
00db04b8 c3 ret


References:
Debugging Microsoft .NET 2.0 Applications, John Robbins
Production Debugging for .NET Framework Applications
SOS: It's Not Just an ABBA Song Anymore
A reading list for debugging, .NET, CLR, WinDBG etc
SOS Debugging Extension Online Reference
.Net exceptions - Tracking down where in the code the exceptions occurred
Back to Basics - How do I get the memory dumps in the first place? And what is SOS.dll?
A Hang Scenario, Locks and Critical Sections
.NET Hang Debugging Walkthrough
Some new SOS functions
Tuesday, March 20, 2007
SOS Debugging with the CLR (Part 1)
A very impressive demonstration on what can be achived with SOS. It also takes care of when to use windbg/sos and when it's just overkill.
Must read:
Jason Zander's WebLog (General Manager, .NET Framework - DevFX)
Reflector for .NET
Must have tool for .NET debugging and reverse engineering:
Reflector is the class browser, explorer, analyzer and documentation viewer for .NET. Reflector allows to easily view, navigate, search, decompile and analyze .NET assemblies in C#, Visual Basic and IL.
Wednesday, March 14, 2007
WinDbg tips and tricks: triple dereference
A very helpful post from Dmitry Vostokov (Crash Dump Analysis) when you want to walk pointer to pointer structures:
Monday, March 05, 2007
Using .NET components in an VB6 host
In order to allow correct objects cleanup on process shutdown of a VB6 executable that uses .NET components via CCWs and RCWs you must explicitly shut down .NET runtime in the unload of the project. Otherwise you can observe nasty crahses.
The easiest way to achive this is using mscoree.CorRuntimeHost.
Simply create an instance of this server an call Stop when your project unloads. With Start you can also control, when the runtime is loaded.
You need to reference mscoree.tlb and mscoree.dll needs to be registered via regasm.
How to load the correct sos.dll
In order to load the correct sos.dll for .NET debugging into WinDbg you can either do this by .load with the full path to the wanted version of sos or you can type the following:
.loadby sos mscorwks
Thursday, December 07, 2006
Scan the stack for an exception record
In a comment of a blog post I found a trick, which I think it worth to mention here:
re: Sucking the exception pointers out of a stack trace which also refers to Finding where unmanaged exceptions came from.
>>
One technique that may be useful is actually searching the stack for the context flags (1003f on x86). It's quick, dirty, and doesn't require symbols, and works 99% of the time on x86.
> s -d esp Lffff 1003f
0535ef48 0001003f 00000000 00000000 00000000 ?...............
> .cxr 0535ef48
<<
Where s -d esp L1000 searches for stack range for the pattern 1003f
There might be one or more matches. Those maches can be passed to '.cxr' which sets the contxt record. Finally a k will dump the stack of the original exception.
Tuesday, October 10, 2006
How to trace function calls with windbg
Have a closer look at the 'wt' command.
When using 'wt' you should not it carefully without specifying any of the -l, -m or -i options. In most cases it makes sense to use the -l option to limit the trace to a certain depth (e.g.: 2 to 5) or to limit it to a certain modult with the -m option.
Output can look like this:
Attach to notepad.exe
Set a break point to...
0:001> bp notepad!FileDragOpen
0:001> g
Now drag a text file into notepad, the breakpoint will hit...
Breakpoint 1 hit
eax=00000000 ebx=00000000 ecx=0007fdb0 edx=7c90eb94 esi=7ca10702 edi=00000000
eip=0100337e esp=0007fdb8 ebp=0007fdc0 iopl=0 nv up ei pl zr na pe nc
cs=001b ss=0023 ds=0023 es=0023 fs=003b gs=0000 efl=00000246
notepad!FileDragOpen:
0100337e 8bff mov edi,edi
0:000> wt -l 2
Tracing notepad!FileDragOpen to return address 01003416
7 0 [ 0] notepad!FileDragOpen
155 0 [ 1] notepad!CheckSave
24 0 [ 2] USER32!SendMessageW
165 24 [ 1] notepad!CheckSave
5 0 [ 2] notepad!__security_check_cookie
167 29 [ 1] notepad!CheckSave
18 196 [ 0] notepad!FileDragOpen
19 0 [ 1] kernel32!CreateFileW
96 0 [ 2] ntdll!RtlInitUnicodeString
33 96 [ 1] kernel32!CreateFileW
32 0 [ 2] kernel32!BaseIsThisAConsoleName
42 128 [ 1] kernel32!CreateFileW
30 0 [ 2] ntdll!RtlDosPathNameToNtPathName_U
133 158 [ 1] kernel32!CreateFileW
4 0 [ 2] ntdll!NtCreateFile
140 162 [ 1] kernel32!CreateFileW
79 0 [ 2] ntdll!RtlFreeHeap
147 241 [ 1] kernel32!CreateFileW
14 0 [ 2] ntdll!RtlFreeHeap
155 255 [ 1] kernel32!CreateFileW
17 0 [ 2] kernel32!SetLastError
163 272 [ 1] kernel32!CreateFileW
24 631 [ 0] notepad!FileDragOpen
3 0 [ 1] notepad!LoadFile
19 0 [ 2] notepad!_SEH_prolog
20 19 [ 1] notepad!LoadFile
91 0 [ 2] kernel32!GetFileInformationByHandle
30 110 [ 1] notepad!LoadFile
4 0 [ 2] USER32!NtUserSetCursor
41 114 [ 1] notepad!LoadFile
67 0 [ 2] kernel32!CreateFileMappingW
50 181 [ 1] notepad!LoadFile
12 0 [ 2] kernel32!MapViewOfFile
53 193 [ 1] notepad!LoadFile
24 0 [ 2] kernel32!CloseHandle
57 217 [ 1] notepad!LoadFile
24 0 [ 2] kernel32!CloseHandle
75 241 [ 1] notepad!LoadFile
12 0 [ 2] notepad!IsInputTextUnicode
81 253 [ 1] notepad!LoadFile
429224 0 [ 2] notepad!IsTextUTF8
430213 instructions were executed in 430212 events (0 from other threads)
Function Name Invocations MinInst MaxInst AvgInst
USER32!NtUserSetCursor 1 4 4 4
USER32!SendMessageW 1 24 24 24
kernel32!BaseIsThisAConsoleName 1 32 32 32
kernel32!CloseHandle 2 24 24 24
kernel32!CreateFileMappingW 1 67 67 67
kernel32!CreateFileW 1 163 163 163
kernel32!GetFileInformationByHandle 1 91 91 91
kernel32!MapViewOfFile 1 12 12 12
kernel32!SetLastError 1 17 17 17
notepad!CheckSave 1 167 167 167
notepad!FileDragOpen 1 24 24 24
notepad!IsInputTextUnicode 1 12 12 12
notepad!IsTextUTF8 1 429224 429224 429224
notepad!LoadFile 1 81 81 81
notepad!_SEH_prolog 1 19 19 19
notepad!__security_check_cookie 1 5 5 5
ntdll!NtCreateFile 1 4 4 4
ntdll!RtlDosPathNameToNtPathName_U 1 30 30 30
ntdll!RtlFreeHeap 2 14 79 46
ntdll!RtlInitUnicodeString 1 96 96 96
0 system calls were executed
ps.: This should hide most of the OS stuff, when you are just interested in your own code:
wt -i MSVCP60 -i OLEAUT32 -i SHLWAPI -i USER32 -i kernel32 -i msvcrt -i msxml4 -i ntdll
How to break on VB6 run time errors
In order to detect VB6 run time errors you need to set a break point to MSVBVM60!EbRaiseExceptionCode and MSVBVM60!EbRaiseException:
bp MSVBVM60!EbRaiseExceptionCode
bp MSVBVM60!EbRaiseException
Or even simpler with e wildcard:
bm /a MSVBVM60!EbRaiseException*
Thursday, September 14, 2006
Notes from a dark corner : A reading list for debugging, .NET, CLR, WinDBG etc
Here you can find a good comprehension of sources to start debugging with windbg...
Notes from a dark corner : A reading list for debugging, .NET, CLR, WinDBG etc
Tuesday, August 08, 2006
How to write parts of the process memory to a file
In order to write parts of the process memory to a file use the .writemem command.
Syntax is .writemem FileName Address Range
Example:
You want to dump a huge BSTR into a file:
Address of the BSTR: 0x0d900024
Get the size (The DWORD receedig the actual string contains the size):
0:000> dc 0x0d900024 - 4
0d900020 005f7a1c ...
.writemem c:\temp\string_content.txt 0x0d900024 L?005f7a1c
Please note the "?" in the size parameter to avoid build in size checks.
Be aware of using the /b option with .dump!
When using /b with .dump in order to generate a cab file you will get the message:
"Creating a cab file can take a VERY VERY long time"
- and this is VERY VERY (!) true.
".Ctrl-C can only interrupt the command after a file has been added to the cab."
- so all you can do is wait and have one cup of coffe after the other :-(
Friday, August 04, 2006
Scan the stack for strings
It is very easy to find stirngs on the stack of life debugging session or in a crash dump.
Simply set the context you are interested in with ~x s (replace x with the thread you are interested in) or set the excption context with .cxr 'address' or .ecxr (dump contains an excpetion record).
Then type:
0:000> da @ebp
You will likely get lots of trash, like this:
0012bf30 "X.."
then type
0:000> da
0012bf34 ".a.w..."
typing 'enter' repeats the last command, so we will walk down the stack by pressig 'enter'
0:000>
0012bf3c "8"
[...]
0:000>
0012c478 "Runtime Error!..Program: ...X.exe"
0012c4b8 "........................................This app"
0012c4d8 "lication has requested the Runti"
0012c4f8 "me to terminate it in an unusual"
0012c518 " way..Please contact the applica"
0012c538 "tion's support team for more inf"
0012c558 "ormation..."
This of course does not not work with strings on the heap.
Simply use 'dda' (or 'ddu' for unicode) to list those.
Subscribe to:
Posts (Atom)


 Posts
Posts


