Preface:
Identifying the source of an error in production applications can be hard task. There are simple errors that can be reproduced with a 'steps to repeat' receipt. Other errors, that are logged as one time only or sporadic are much more difficult. In order to adress them, you can spent tons of time to find a way to create the bug and possibly you will never succeed. In deep this does not mean that this defect does not exist! It is just a matter of probability until it reoccurs. So it is aimed to catch that thing at the first occurrence and gather as much information as reasonable.
How to setup:
First you must make sure your build creates pdbs for all release binaries. Those need to be checked in or sent to a symbol server.
Next thing to do, is to catch all unhandled exceptions:
AppDomain.CurrentDomain.UnhandledException += new UnhandledExceptionEventHandler(AppDomainUnhandledException); (*)
Application.ThreadException += new System.Threading.ThreadExceptionEventHandler(Application_ThreadException);
(*) needs
[SecurityPermission(SecurityAction.Demand,ControlAppDomain=true)]
In the exception handler, which is ideally ONE function, you need to implement the user notification and the dump generation:
private static void HandleException(Exception ex)
{
if (ex == null)
return;
// ExceptionPolicy.HandleException(ex, "Default Policy");
MessageBox.Show("An unhandled exception occurred, and the application is terminating. For more information, see your Application event log.");
CCLRDump.Dump();
Application.Exit();
}
You will notice two specialities in this function.
One is the commented 'ExceptionPolicy.HandleException(ex, "Default Policy");'. This refers to Exception Handling Application Block which can be greatly combined with this mechanism.
The other thing is "CCLRDump.Dump();" This is a wrapper class around ClrDump (© Oleg Starodumov, 2004 - 2006 ).
The implementation is fairly easy :
[C#]
[Flags]
enum MINIDUMP_TYPE {
MiniDumpNormal = 0x00000000,
MiniDumpWithDataSegs = 0x00000001,
MiniDumpWithFullMemory = 0x00000002,
MiniDumpWithHandleData = 0x00000004,
MiniDumpFilterMemory = 0x00000008,
MiniDumpScanMemory = 0x00000010,
MiniDumpWithUnloadedModules = 0x00000020,
MiniDumpWithIndirectlyReferencedMemory = 0x00000040,
MiniDumpFilterModulePaths = 0x00000080,
MiniDumpWithProcessThreadData = 0x00000100,
MiniDumpWithPrivateReadWriteMemory = 0x00000200,
MiniDumpWithoutOptionalData = 0x00000400,
MiniDumpWithFullMemoryInfo = 0x00000800,
MiniDumpWithThreadInfo = 0x00001000,
MiniDumpWithCodeSegs = 0x00002000,
MiniDumpWithoutManagedState = 0x00004000,
};
[...]
[DllImport("clrdump.dll", CharSet = CharSet.Unicode, SetLastError = true)]
private static extern Int32 CreateDump(Int32 ProcessId, string FileName,
Int32 DumpType, Int32 ExcThreadId, IntPtr ExtPtrs);
[...]
public static void Dump()
{
IntPtr pEP = System.Runtime.InteropServices.Marshal.GetExceptionPointers();
CreateDump(
System.Diagnostics.Process.GetCurrentProcess().Id,
@"C:\temp\test.dmp",
(Int32)MINIDUMP_TYPE.MiniDumpWithFullMemory,
AppDomain.GetCurrentThreadId(),
pEP);
}
Ok, now we have setup everything to catch all the nasty stuff, that can happen in our application.
Analyzing those MiniDumps
[please read this post, before moving on...]
In order to analyze those special minidumps some magic is needed. There are several blog posts, articles, books, etc. about how to deal with Dumps in managed and unmanaged manner. I will list some of them I found very supporting at the end of this post. As the most common question is: "Where is the source of ^%!&@ exception" I will deal with that:
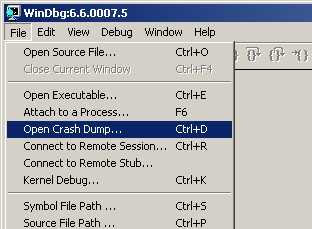
- Open the crash dump in Windbg
- Make sure you have the correct symbol path (currently no symbol server as 6.6.7.5 has a bad bug with symbol loading - instead use C:\Program Files\Microsoft Visual Studio 8\SDK\v2.0\symbols\) and image path. Type .reload to get the correct symbols.

- Load correct sos (Son of Strike): .loadby sos mscorwks
0:000> .loadby sos mscorwks - !Threads gives you on overview of managed threads (with exceptions)
0:000> !Threads
ThreadCount: 2
UnstartedThread: 0
BackgroundThread: 1
PendingThread: 0
DeadThread: 0
Hosted Runtime: no
ID OSID ThreadOBJ State GC Context Domain Count APT Exception
0 1 1224 001506c0 6020 Enabled 00000000:00000000 0014e808 0 STA System.NullReferenceException (0138fec8)
2 2 153c 00156158 b220 Enabled 00000000:00000000 0014e808 0 MTA (Finalizer) - !pe will dump the last exception on the current thread. Unfortunately this will just give you the function name and not the source line - but with some effort, we can extract this information... For now remember the IP address of the function that threw (we need this later)
0:000> !pe
Exception object: 0138fec8
Exception type: System.NullReferenceException
Message: Object reference not set to an instance of an object.
InnerException:
StackTrace (generated):
SP IP Function
0012EFF0 00DB04AD Demo1._FormDemo1.ItsNorMe()
0012F000 00DB0451 Demo1._FormDemo1.ItsNeitherMe()
0012F008 00DB041D Demo1._FormDemo1.button1_Click(System.Object, System.EventArgs)
0012F018 7B060A6B System.Windows.Forms.Control.OnClick(System.EventArgs)
0012F028 7B105379 System.Windows.Forms.Button.OnClick(System.EventArgs)
0012F034 7B10547F System.Windows.Forms.Button.OnMouseUp(System.Windows.Forms.MouseEventArgs)
0012F058 7B0D02D2 System.Windows.Forms.Control.WmMouseUp(System.Windows.Forms.Message ByRef, System.Windows.Forms.MouseButtons, Int32)
0012F0A4 7B072C74 System.Windows.Forms.Control.WndProc(System.Windows.Forms.Message ByRef)
0012F108 7B0815A6 System.Windows.Forms.ButtonBase.WndProc(System.Windows.Forms.Message ByRef)
0012F144 7B0814C3 System.Windows.Forms.Button.WndProc(System.Windows.Forms.Message ByRef)
0012F14C 7B07A72D System.Windows.Forms.Control+ControlNativeWindow.OnMessage(System.Windows.Forms.Message ByRef)
0012F150 7B07A706 System.Windows.Forms.Control+ControlNativeWindow.WndProc(System.Windows.Forms.Message ByRef)
0012F164 7B07A515 System.Windows.Forms.NativeWindow.Callback(IntPtr, Int32, IntPtr, IntPtr) - !DumpStack will give you full stack trace with all managed and unmanaged frames (pretty large...). In this stack search for "====> Exception cxr@" and remember the return adress (2nd adress from the beginning)
0:000>
0:000> !DumpStack
OS Thread Id: 0x1224 (0)
Current frame: ntdll!KiFastSystemCallRet
ChildEBP RetAddr Caller,Callee
[... lots of stuff ...]
0012eff0 00db04ac (MethodDesc 0xa25aa8 +0x44 Demo1._FormDemo1.ItsNorMe()) ====> Exception cxr@12ed24
[... lots of stuff ...]
0012eff8 00db0451 (MethodDesc 0xa25aa0 +0x19 Demo1._FormDemo1.ItsNeitherMe()), calling 00a264d8
0012f000 00db041d (MethodDesc 0xa25a98 +0x1d Demo1._FormDemo1.button1_Click(System.Object, System.EventArgs)), calling 00a264c4
0012f00c 7b060a6b (MethodDesc 0x7b4a6598 +0x57 System.Windows.Forms.Control.OnClick(System.EventArgs))
0012f020 7b105379 (MethodDesc 0x7b5ab788 +0x49 System.Windows.Forms.Button.OnClick(System.EventArgs)), calling (MethodDesc 0x7b4a6598 +0 System.Windows.Forms.Control.OnClick(System.EventArgs))
0012f02c 7b10547f (MethodDesc 0x7b5ab798 +0xc3 System.Windows.Forms.Button.OnMouseUp(System.Windows.Forms.MouseEventArgs))
0012f050 7b0d02d2 (MethodDesc 0x7b5a59d8 +0xf2 System.Windows.Forms.Control.WmMouseUp(System.Windows.Forms.Message ByRef, System.Windows.Forms.MouseButtons, Int32))
0012f094 7b072c74 (MethodDesc 0x7b5a5a50 +0x544 System.Windows.Forms.Control.WndProc(System.Windows.Forms.Message ByRef)), calling (MethodDesc 0x7b5a59d8 +0 System.Windows.Forms.Control.WmMouseUp(System.Windows.Forms.Message ByRef, System.Windows.Forms.MouseButtons, Int32))
0012f100 7b0815a6 (MethodDesc 0x7b5aba60 +0xce System.Windows.Forms.ButtonBase.WndProc(System.Windows.Forms.Message ByRef)), calling (MethodDesc 0x7b5a5a50 +0 System.Windows.Forms.Control.WndProc(System.Windows.Forms.Message ByRef))
0012f128 7b07a608 (MethodDesc 0x7b5af1c0 +0x48 System.Windows.Forms.Message.Create(IntPtr, Int32, IntPtr, IntPtr)), calling (JitHelp: CORINFO_HELP_GETSHARED_NONGCSTATIC_BASE_NOCTOR)
0012f13c 7b0814c3 (MethodDesc 0x7b5ab7c0 +0x2b System.Windows.Forms.Button.WndProc(System.Windows.Forms.Message ByRef)), calling (MethodDesc 0x7b5aba60 +0 System.Windows.Forms.ButtonBase.WndProc(System.Windows.Forms.Message ByRef))
0012f144 7b07a72d (MethodDesc 0x7b5a8168 +0xd System.Windows.Forms.Control+ControlNativeWindow.OnMessage(System.Windows.Forms.Message ByRef))
0012f148 7b07a706 (MethodDesc 0x7b5a8180 +0xd6 System.Windows.Forms.Control+ControlNativeWindow.WndProc(System.Windows.Forms.Message ByRef)), calling 00a3704e
0012f15c 7b07a515 (MethodDesc 0x7b4a7d60 +0x75 System.Windows.Forms.NativeWindow.Callback(IntPtr, Int32, IntPtr, IntPtr))
[... lots of stuff ...]
0012ffb0 79011b5f mscoree!_CorExeMain+0x2c
0012ffc0 7c816fd7 kernel32!RegisterWaitForInputIdle+0x49 - Now lets unassamble the function that threw (!u
).
You'll get an machine code listing of that function. Now simply search for the second address to remember and there it is.All you need to do is to synchronise machine code with the source code, which is much easier with .NET code compared to C++ code.
0:000> !u 00DB04AD
Normal JIT generated code
Demo1._FormDemo1.ItsNorMe()
Begin 00db0468, size 51
private void ItsNorMe()
{
00db0468 57 push edi
00db0469 56 push esi
00db046a 50 push eax
00db046b 890c24 mov dword ptr [esp],ecx
00db046e 833dc82da20000 cmp dword ptr ds:[0A22DC8h],0
00db0475 7405 je 00db047c
*** WARNING: Unable to verify checksum for mscorlib.ni.dll
*** ERROR: Module load completed but symbols could not be loaded for mscorlib.ni.dll
00db0477 e8821e2e79 call mscorlib_ni+0x221e82 (792e1e82) (mscorlib_ni)
00db047c 33f6 xor esi,esi
00db047e 90 nop
00db047f b9fcf91979 mov ecx,offset mscorlib_ni+0xdf9fc (7919f9fc)
00db0484 e8931bc6ff call 00a1201c (JitHelp: CORINFO_HELP_NEWSFAST)
00db0489 8bf8 mov edi,eax
00db048b 8bcf mov ecx,edi
Listl = new List ();
00db048d e83ea97a78 call mscorlib_ni+0x49add0 (7955add0) (System.Collections.Generic.List`1[[System.Int32, mscorlib]]..ctor(), mdToken: 0600194d)
00db0492 8bf7 mov esi,edi
00db0494 8bce mov ecx,esi
00db0496 ba01000000 mov edx,1
00db049b 3909 cmp dword ptr [ecx],ecx
l.Add(1);
00db049d e8aec77a78 call mscorlib_ni+0x49cc50 (7955cc50) (System.Collections.Generic.List`1[[System.Int32, mscorlib]].Add(Int32), mdToken: 0600195e)
00db04a2 90 nop
l = null;
00db04a3 33f6 xor esi,esi
00db04a5 8bce mov ecx,esi
00db04a7 ba02000000 mov edx,2
00db04ac 3909 cmp dword ptr [ecx],ecx
l.Add(2);
00db04ae e89dc77a78 call mscorlib_ni+0x49cc50 (7955cc50) (System.Collections.Generic.List`1[[System.Int32, mscorlib]].Add(Int32), mdToken: 0600195e)
00db04b3 90 nop
00db04b4 90 nop
00db04b5 59 pop ecx
00db04b6 5e pop esi
00db04b7 5f pop edi
00db04b8 c3 ret


References:
Debugging Microsoft .NET 2.0 Applications, John Robbins
Production Debugging for .NET Framework Applications
SOS: It's Not Just an ABBA Song Anymore
A reading list for debugging, .NET, CLR, WinDBG etc
SOS Debugging Extension Online Reference
.Net exceptions - Tracking down where in the code the exceptions occurred
Back to Basics - How do I get the memory dumps in the first place? And what is SOS.dll?
A Hang Scenario, Locks and Critical Sections
.NET Hang Debugging Walkthrough
Some new SOS functions


7 comments:
Could you please give a sample code? Thanks.
I put the important snippets into the post. Could you tell me, what you are missing?
Oh, I got a problem when built the clrdump wrapped class. So I think if a complete code package would be good for me.
Another question, could it dump the entire stack frame for both managed and unmanaged callstack? I mean, in many cases, I only saw managed stack even the exception occured at unmanaged side and finally got caught at managed side. I say your comment, just wanna affirm it.
Thanks.
In addtion, could just dbghelp.dll work the same way?
Thx.
1.) I didn't find an easy way of attaching files to by postings. Could you send me a small message to vve(at)gmx.de. Then I will send you the class.
2.) The minidump that gets created contains the full story: managed and unmanaged. Sos function !DumpStack gives you this picture of managed and managed code.
3.) Honestly I must say, that I'm just using dbghelp.dll in production environment and it worked good in most of the cases. I assume Oleg (http://www.debuginfo.com/tools/clrdump.html) is doing additional magic to add more information, but you need to ask him.
Did you get my email?
What's parameters used in your MiniDumpWriteDump(...) method?
In my practice, the generated minidump was almost invalid, and little info for tracing. I'm afraid there were some incorrect params.
Thanks.
As you can see in the post, I've been using MINIDUMP_TYPE.MiniDumpWithFullMemory to show all possibilies of dump analysis. I also tested it with MINIDUMP_TYPE.MiniDumpScanMemory and this works fine besides I'm getting few complaints from windbg.
Post a Comment