One of the hardest things is debugging a reference count leak. COM objects lifetime depends on the reference count (read here for more...). So each client of a COM object must call AddRef on the IUnknown interface when going to use it and it must call Release when done. If any client (and there might be many many of a single one) violates this rule you get into severe trouble.
Scenarios
1.) Number of Release calls = Number of AddRef calls
This is the normal scenario: As soon as no client needs the server object anymore it is getting destroyed
2.) Number of Release calls > Number of AddRef calls
If Release is called one time too often another client might crash because the server get's destroyed too early - bad thing here is that you see the crash in some place but this does not tell you where is root cause is located. All you know is which objects reference count has been corrupted.
3.) Number of AddRef calls > Number of Release calls
If AddRef is called one time too often the reference count never reaches 0 and hence the server object never get's destroyed. This is causing memory leaks and also might cause resource leaks. The effect of this scenario is much less obvious: You might see memory increasing over time and/or performance degrade and/or resources to be locked when they should be unlocked again.
Finding the place where the unbalanced AddRef/Release occurred might be like finding the needle in the hay. I did research in the Google reachable web but didn't find a good tool available that really assist's in this task. Luckily Sara Ford described in this post the first step you need to take in order to get the data necessary to drill down into the problem.
Somehow I didn't manage to set the trace points in Visual Studio 2005 (can anybody tell me how to set a break point on a single objects AddRef, Release methods?) so I launched my beloved WinDbg.
First I created script to create me an xml snippet for an event that alters the ref count (I didn't find a better name so I called it ToXml.txt and placed it into my scripts folder):
.printf "-->\n<Event><Ref>%d</Ref><![CDATA[",poi(${$arg1})
k100
.printf "]]></Event>\n<!--\n"
Then I placed a break point on the server objects constructor
bp MyServer!CMyClass::CMyClass
When the breakpoint hit, I stepped out <Shift>+<H11> into CComCreator::CreateInstance and then stepped over the p->SetVoid(pv); call in this class.
(I think it should be possible to set a breakpoint directly at MyServer!ATL::CComCreator<ATL::CComObject<CMyClass> >::CreateInstance+0xb1, but I didn't try...)
Now I gathered the address of m_dwRef by:
0:000> ?? &(p->m_dwRef)
long * 0x110d724c
Next thing to do is setting the data breakpoint by:
ba w4 0x110d724c "$$>a<C:/windbg/scripts/ToXml.txt 0f084cb4;gc"
(you might need to change the path 'C:/windbg/scripts/')
With .logopen we make sure that we directly write all events into an logfile:
.logopen c:\temp\Events.xml
Now let the application run with 'g' or <F5> and do whatever creates your ref counting problem.
When done break into and close the log with .logclose.
At this point we are half the way through. The Events.xml we created is not valid xml. You need to add
<?xml version="1.0" encoding="UTF-8"?>
<Events>
<!--
at the beginning and
--></Events>
at the end.
Now comes the tooling. In my scenario I had around 1400 Events - a little tedious to analyze all by hand.
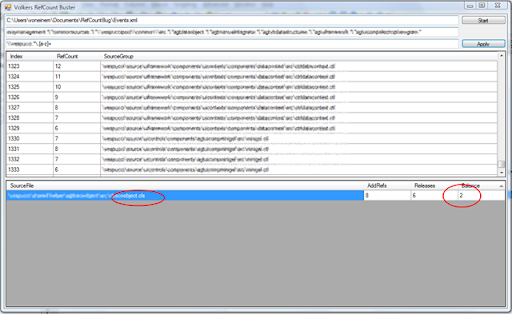
So I created "Volkers RefCount Buster" which does the following:
1.) After loading the file (enter path in first text box and press Start) all events are identified for either beeing AddRef or Release
2.) Then the call stack is taken to group the events:
First action is to exclude events that match the pattern entered in the second text box (exclude pattern):
var includeQuery = from frame in this.StackFrames.Frames
where String.IsNullOrEmpty(ExcludePattern) ? true : !excludePattern.IsMatch(frame)
select frame;
Then the remaining frames are searched for the selection pattern:
var selectionQuery = from frame in includeQuery
let match = selectionPattern.Match(frame)
where match.Success
select match.Value;
and the top most match is taken:
string sourceGroup = selectionQuery.FirstOrDefault();
the all events are grouped into the found source groups:
var ResultQuery = from refCountEvent in refCountEvents
group refCountEvent by refCountEvent.SourceGroup into g
select g;
Then the number of AddRefs and Releases is calculated for each group and accumulated:
foreach (var ResultSet in ResultQuery)
{
long numOfAddRefs = (from rce in ResultSet.AsEnumerable()
where rce.RefCountType == EventType.AddRef
select rce).Count();
long numOfReleases = (from rce in ResultSet.AsEnumerable()
where rce.RefCountType == EventType.Release
select rce).Count();
long balance = numOfAddRefs - numOfReleases;
...
Now it's up to you to find the Exclude Pattern and Selection Pattern that will directly point you to the component or file, that is the culprit. Then you just need to look at those stacks that belong to the found bad guy and you will also be able to see the source line that created the problem.
You can download the sources and binaries here...
Have fun,
Volker


7 comments:
I used your technique with much success, thanks for posting it. I even wrote a similar application to yours to parse the XML output.
However, I was confused by your explanation of setting the data breakpoint. In your example, you get the address of the refcount variable, but then set the breakpoint on a different address. Was this just a misprint, or am I missing an important step?
I ended up doing things slightly differently, where I had two windbg scripts, one for addref, and one for release. I then used 'bm /a MyModule!*MyClass*AddRef*' to set breakpoints on calls to addref, and likewise to release. I had to delete the 'thunks' that were in there, but it seemed to work.
Could I have simplified this using your data breakpoint?
Thanks for the hint. This is really a misprint which I will correct now.
For your last question: I also started with the approach of setting a normal break point on AddRef and Release ending with the data breakpoint which makes things much easier.
Again I am curious about something.
Is your break-on-access method REQUIRED for making sure that you get every addref/release to the object in question? Can COM somehow change the reference count of the object with out going thru that objects addref/release functions? ie, using perhaps the unknown interface directly?
My problem is that I don't know which object instance is leaking! I have run UMDH to get a list of leaks, so I know the type of the object, but thats it! That is what led me to use regular breakpoints based on the classname listed in the UMDH stacktrace.
Any hints would be helpful...
Hard to tell if the memory break point is required but I would say it's a good idea because the com server has direct access to the ref count member.
How do you know, that you have a COM object leak, if you down know which object is leaking?
Well, I know that there should be no COM objects left allocated after a certain point in our application. (when we close a file, after parsing it). Every COM object should have been deleted when the file was closed. Therefore, I run UMDH after the file is closed, and any COM objects listed are leaking.
The problem is that a given stacktrace in UMDH might have a few hundred (or even thousand) different allocations. Let alone the number of times each one of those allocations is addref/released!!!
So I can set a memory breakpoint on the first object allocated, but there is no guarantee that it is leaking! Because there might be some objects of that same type that are correctly addref/released in other parts of our application that do not leak!
It is almost like I need to set a breakpoint in the construction of the object type, but only have the breakpoint set a memory breakpoint on ITS ref count object pointer that triggers the xml output script, and then continues. Basically, automating the first part of your method.
hmmmmmm.......the magic of windbg! I don't know if it'll work, but I'll report back if it does!
Just a little update. I was actually able to finish fixing my leaks by using the bm /a technique to put separate AddRef/Release breakpoints. This allowed me to track every object instance created, rather than just one. There were some gotcha's, but those were due to our own implementation details, not a failure in the debugging technique.
So anyway, thank you so much for posting this. It is what allowed me to fix this error!
Good to hear that!
Post a Comment